Many traders struggle to find clarity in technical analysis. Some rely heavily on indicators like RSI or MACD, while others go in the opposite direction — trusting only price movement.
In this article, we’ll explore the debate between price action vs indicators to understand which approach offers more clarity, speed, and control in live market condition
1. Price Action vs Indicators: Why Use the Derivative When You Can Use the Source?
Most technical indicators are just mathematical interpretations of price — based on averages, momentum, or volatility.
So if price is the foundation, why not read it directly? A clean chart allows traders to interpret market intent without additional filters or delay.
2. Indicators Often React Too Late
One of the biggest challenges with indicators is that they respond to what’s already happened.
They often signal too late, especially in fast-moving markets — and that can result in poor entries or missed trades.
By contrast, price action setups form in real time. Recognizing a shift in structure, like a trendline break or failed retest, can offer a much earlier edge.
3. Simplicity Wins: Less Noise, Better Decisions
Charts overloaded with tools tend to create hesitation.
Complex setups may look impressive, but in practice, they often slow down decision-making — especially for discretionary traders.
Simpler charts with a focus on context and structure tend to promote faster, more confident execution.
4. Everything You Need Is in the Candle
Candlestick bars reveal more than most traders give them credit for.
The size, position, and sequence of candles — in relation to prior bars and market structure — can indicate pressure, exhaustion, and potential continuation or reversal.
By studying patterns bar by bar, you train your eyes to detect imbalances as they form — not after they’re confirmed by a delayed indicator.
5. Price Action Is Not Just Simpler — It’s More Transparent
Ultimately, price action vs indicators is a matter of how close to the market’s raw information you want to be.
Price action gives you that information directly, as it happens, with no lag and no abstraction.
It’s not just a simpler approach — it’s one that forces clarity, discipline, and awareness of market psychology.
Example
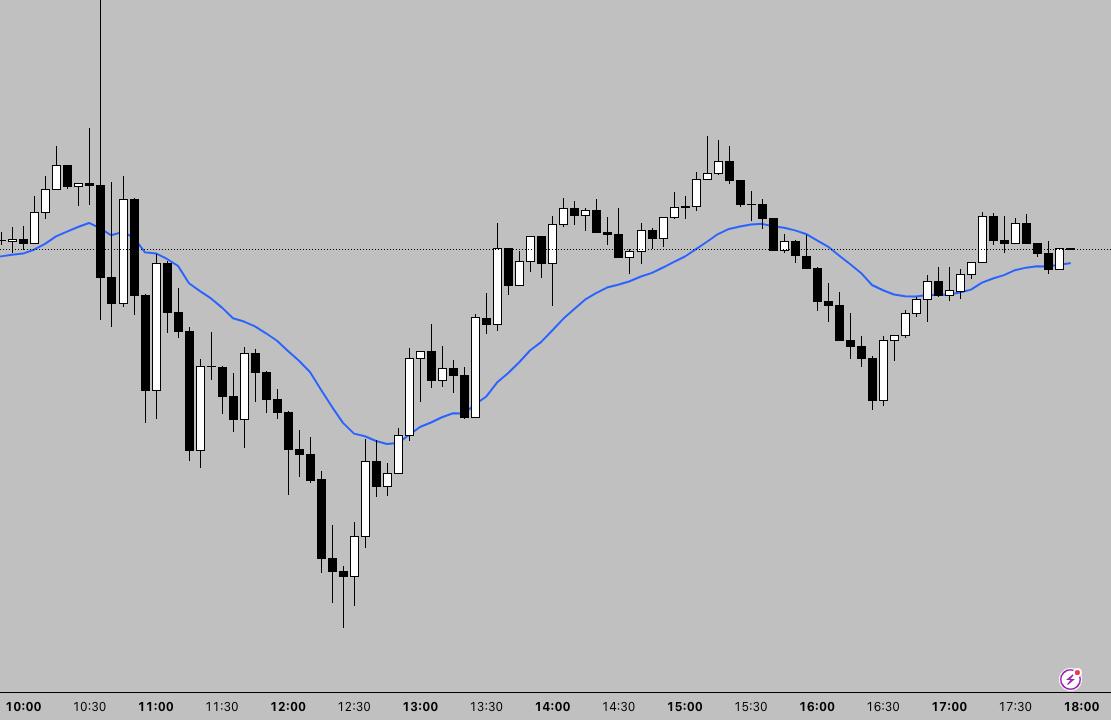
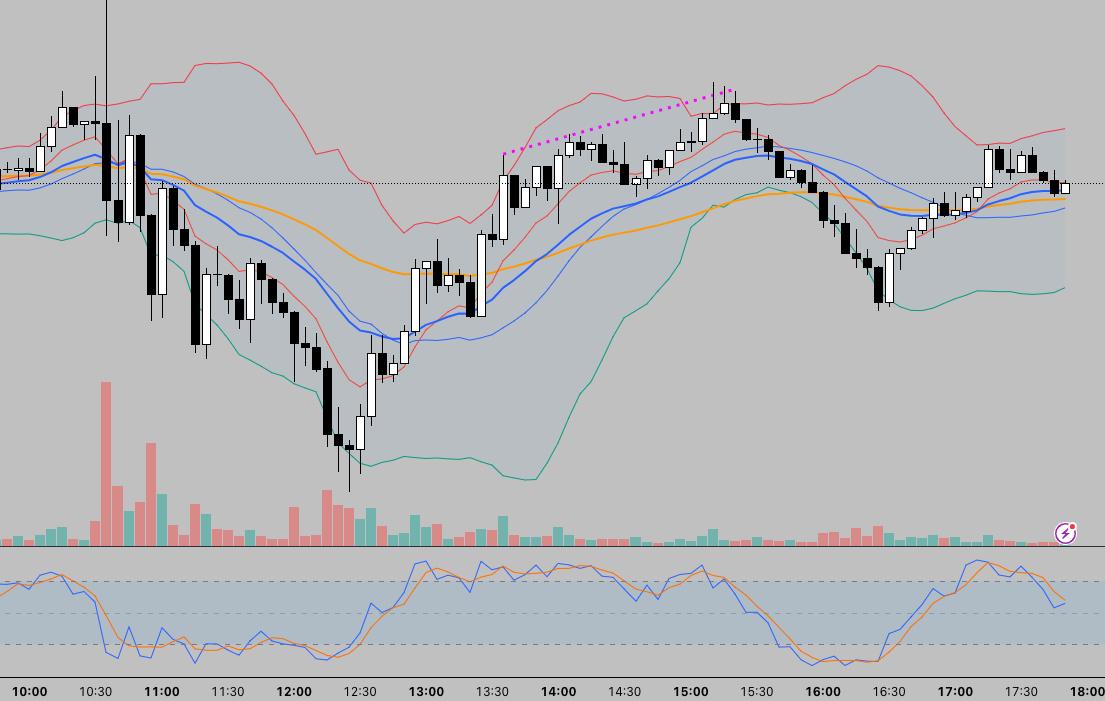
Side-by-side example: clean price action vs indicator-heavy trading chart.
Final Thoughts
You don’t need layers of indicators to trade with confidence.
Price tells the story.
When you focus on the chart itself — not the tools built on top of it — you’ll see the market more clearly, respond faster, and trade with greater conviction.
“The best setups are often the simplest — but not the easiest to spot.”
Continue Your Journey
Curious to strengthen your price action foundation even more?
Start with this: What Is Price Action? A Beginner’s Guide to Clean Charts
And if you’re ready to go deeper into structure-based trading, the Brooks Trading Course is a widely respected resource designed for traders who want to master pure price action — bar by bar.