The market is in a constant search for a “fair price,” a point of equilibrium where both buyers and sellers feel they can make money. And in this eternal search for a value that never stops moving, the market repeats a predictable cyclical behavior.
Al Brooks — widely recognized for developing his own price action method — teaches that successful traders don’t get lost in exotic candle patterns or dozens of indicators. They focus on one thing: understanding which phase of this cycle the market is in to adapt their strategy.
The Constant Search for a Fair Price: Trend vs. Trading Range
The market is always probing up and down, trying to find an area where most traders feel confident to operate. Most of these attempts (rallies or selloffs) fail, and the market gets stuck in a trading range.
In this “area of confusion,” both bulls and bears feel that the price is good enough to start their opposite trades. But eventually, one side wins the battle and generates a breakout. This means the confusion is over and there is a consensus: the price is “wrong.” The market then quickly moves to a new area of confusion, and the cycle begins again.
The Three Phases of the Market Cycle: Where the Money Is
The cycle manifests in three main phases on every chart:
Phase 1: The Breakout
This is the strongest phase of the trend, where the market advances with conviction and trend bars are consistent.
- Characteristics: High probability of continuation (follow-through), fast movement.
- Strategy: This is the time to act quickly. In strong breakouts, do not wait for a pullback, as it may be a long time coming, and you would miss the strongest part of the trend.
- Warning: The risk is higher, as stops can be further away, and the speed of the movement increases the chances of errors.
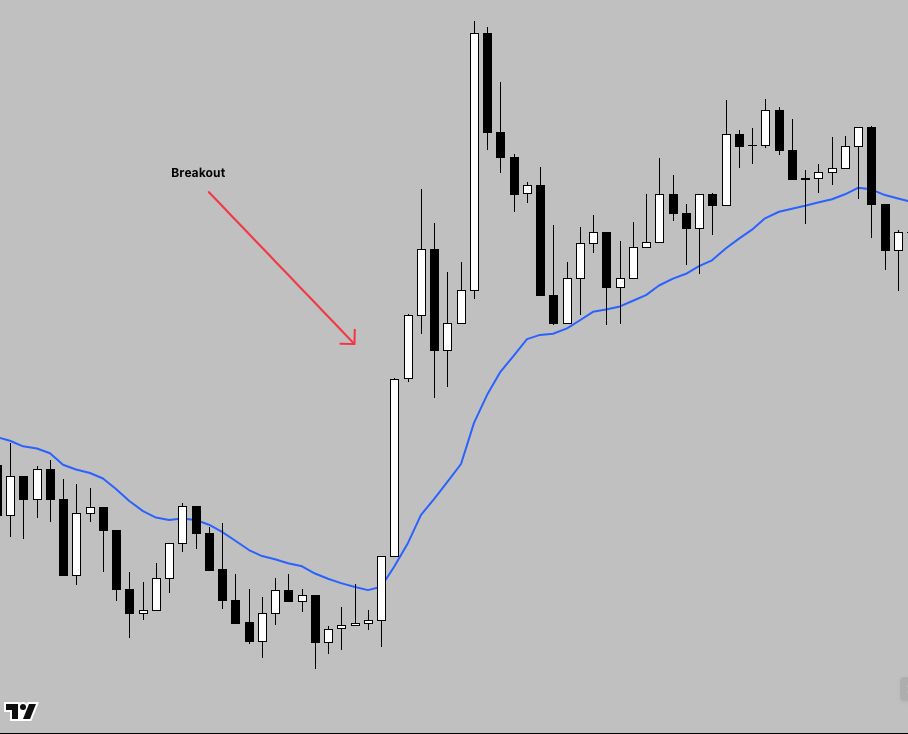
breakout
Phase 2: The Channel Phase
After the breakout, the market has its first pullback and enters the channel phase. The trend continues, but in a more moderate way, with more two-sided price action.
- Characteristics: Control is alternated between buyers and sellers, but one side still dominates. Pullbacks become more frequent and deeper.
- Brooks’s Warning: A channel, while part of a trend, is almost always the beginning of a trading range. Therefore, every bull channel should be seen as a potential bear flag, and vice-versa.
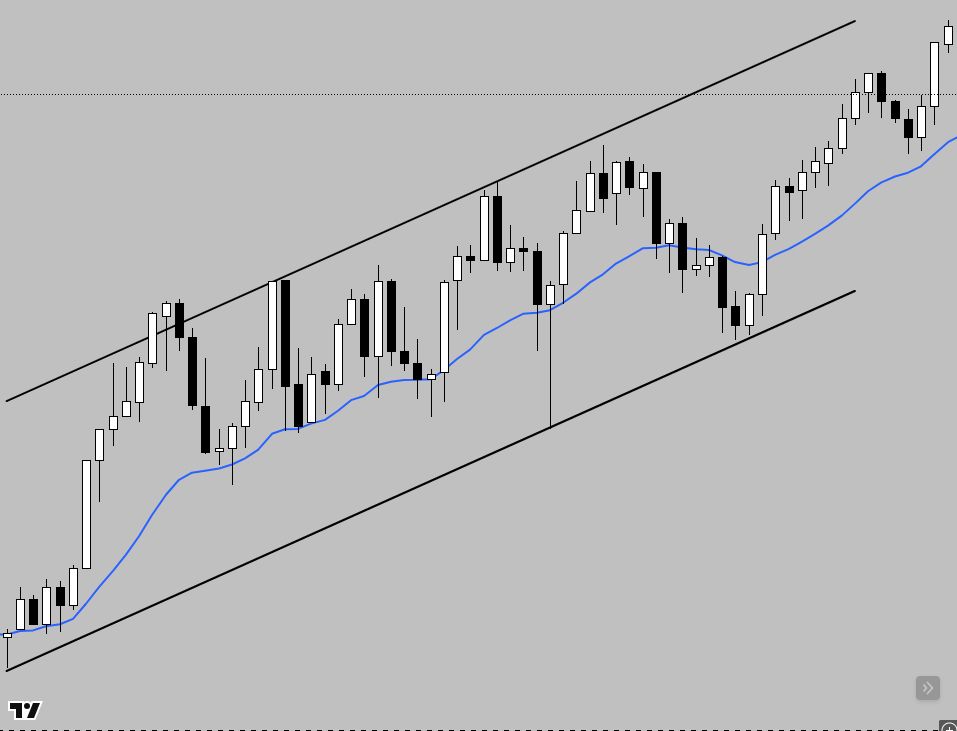
bull channel
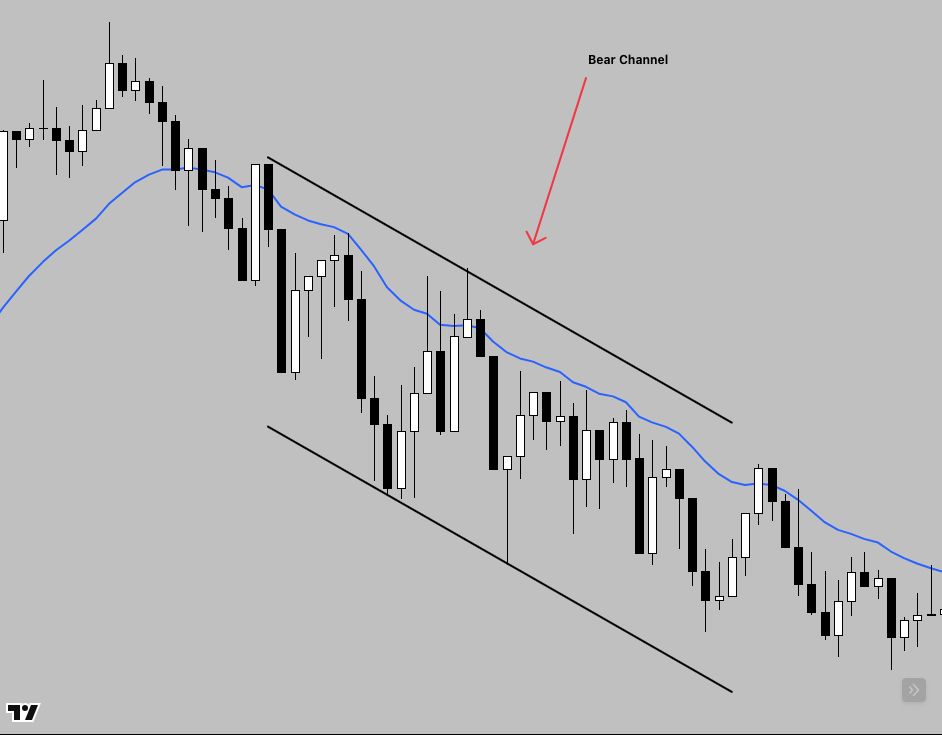
bear channel
Phase 3: The Trading Range
This is the natural evolution of a channel. With two-sided trading increasing, pullbacks deepen and the market’s direction is lost.
- Characteristics: The market has no clear bias. The probability of a breakout to the upside is as high as to the downside.
- Strategy: The best approach is to “buy low and sell high,” operating at the boundaries of the trading range.
- Opportunity: The seeds of the next trend are planted in this phase of indecision.
trading range
Reading a Single Chart: No More Is Needed
Al Brooks assures us that you do not need multiple timeframes to be profitable. Every trader only needs the chart in front of them to find opportunities, as every chart has all three phases of the cycle.
Remember the 90/10 rule: 90% of the time, the market is either in a channel or a trading range (where it’s best to buy support and sell resistance), and 10% of the time it’s in a breakout phase (where it’s best to enter in the direction of the breakout without waiting).
The keys to success are:
- Learning to identify setups before it’s too late.
- Structuring the trade with a clear mathematical logic (risk-reward).
- Managing the trade appropriately.
The Power of Active Reading: Gaps and Pressure Signals
Mastering this cycle means actively reading what price is doing. Gaps, for example, are not just empty spaces. In Brooks’s view, a gap is any space between support and resistance. They, along with signals like consecutive trend bars, strong closes, and the absence of opposing trend bars, are crucial clues about the market’s strength and momentum.
These signals help us identify which of the three phases of the cycle the market is in, allowing the trader to adapt their strategy to that reality.
Final Thoughts
The market is a ceaseless cycle of trend and trading range. The key to consistent trading, according to Al Brooks, is the ability to read this cycle and adapt to it. It’s not about predicting where the price is going, but about identifying which phase it’s in and what the high-probability behavior for that phase is.
If you are ready to dive even deeper into the Price Action methodology directly from the source and unravel every nuance of market reading, consider exploring Al Brooks’s complete study material. It’s a journey that will transform how you see and trade the market.
Related Posts
New here? Start with Learn Price Action Trading: A Beginner’s Guide
Already getting the basics? Then Bar-by-Bar Reading: The Foundation of Price Action Trading is your next step
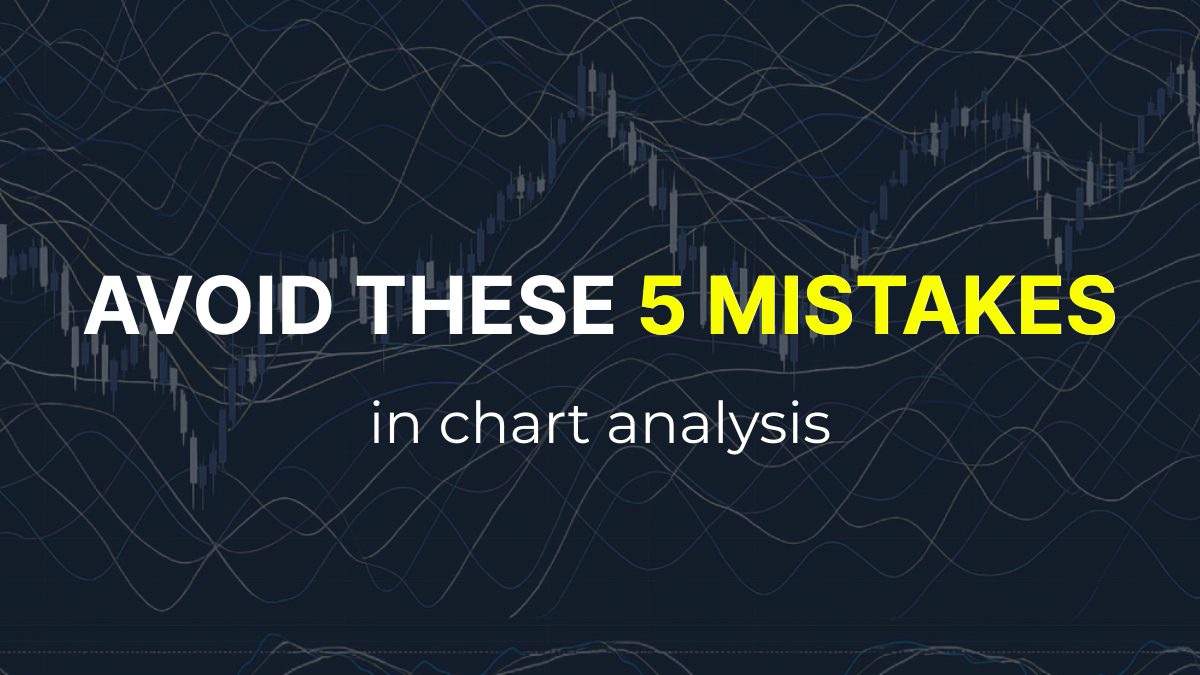
Feeling more advanced? Explore deeper insights in Chart Analysis Mistakes: 5 Errors Every Trader Must Avoid